FOR IMMEDIATE PUBLICATION
JANUARY TO JUNE 2016 STATISTICAL REPORT
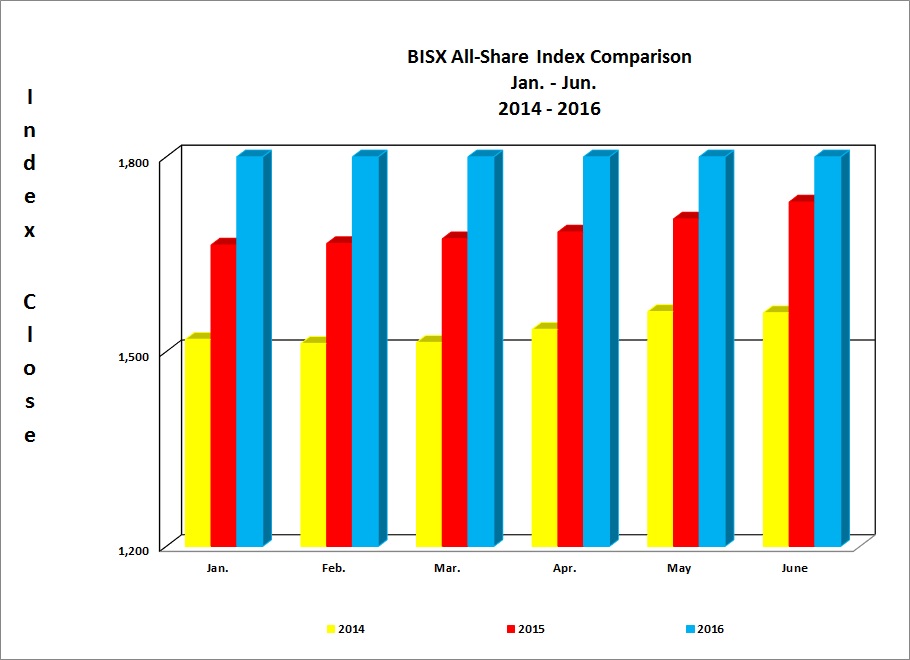 BISX All-Share Index Comparison 2014 - 2016[/caption] BISX is pleased to announce its BISX All-Share Index and trading statistics for the six month period ending June 30, 2016 with comparison to the same period of 2015.
For the six month period ending June 30, 2016 the BISX All-Share Index closed at 1,963.81. This represents a year to date increase of 139.96 or 7.67%. By comparison for the six month period ending June 30, 2015 the BISX All-Share Index closed at 1,730.34. This represented a year to date increase of 71.04 or 4.28%. The BISX All-Share Index is a market capitalization weighted index comprised of all primary market listings excluding debt securities.
As at June 30, 2016 the market was comprised of 20 ordinary shares with a market capitalization of $4.17 Billion. In addition, there were 13 preference shares with a market capitalization of $327.36 Million and 16 bonds with a face value of $505 Million.
Over the 6 month period January 1 to June 30, 2016, some international equity markets have experienced increases as indicated by the chart below:
| Closing Date | MSCI Emerging Market Index | S&P 500 Index | FTSE 100 Index | BISX All Share Index |
| Dec 31, 2015 | 794.139 | 2,043.94 | 6,242.30 | 1,823.95 |
| Jun 30, 2016 | 834.100 | 2,098.86 | 6,504.33 | 1,963.91 |
| Percentage Change (+/-) | 5.03% | 2.69% | 4.20% | 7.67% |
Trading volume for the six month period January 1, 2016 to June 30, 2016 was 2,960,687 shares for a value of $15,450,808.65. Trading volume for the six month period January 1, 2015 to June 30, 2015 was 1,187,758 shares for a value of $7,572,515.49.
Trading volume for the three month period April 1, 2016 to June 30, 2016 was 2,061,562 shares for a value of $8,113,378.95. Trading volume for the three month period April1, 2015 to June 30, 2015 was 588,771 shares for a value of $3,414,740.17.
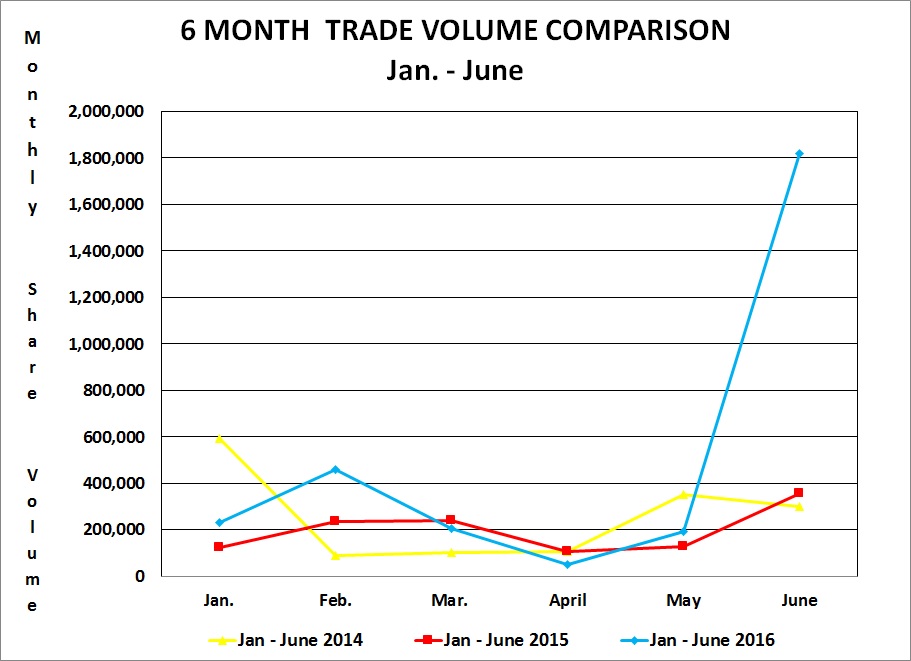
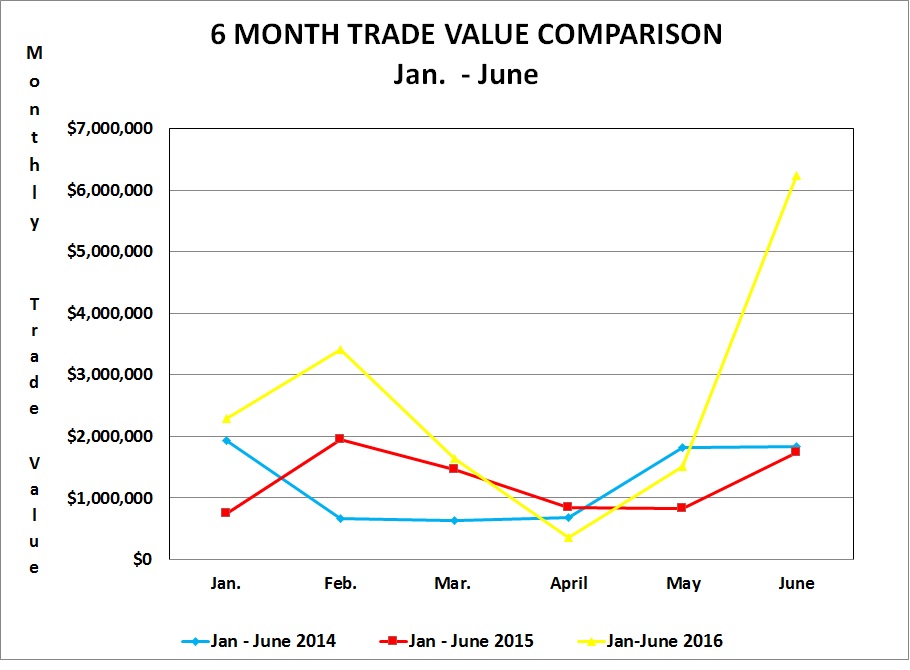
For the six month period from January 1, 2016 to June 30, 2016, the average volume per trading day was 23,590 shares for a value of $123,531.68. By comparison, for the six month period from January 1, 2015 to June 30, 2015, the average volume per trading day was 9,547 shares for an average value of $61,311.42.
| Month | Avg. volume / trading day (2015) | Avg. volume / trading day (2014) | Avg. value / trading day (2015) | Avg. value / trading day (2014) |
| January | 11,672 | 6,176 | $114,183.37 | $37,290.51 |
| February | 21,979 | 11,754 | $162,333.08 | $97,775.11 |
| March | 9,720 | 10,927 | $78,322.27 | $66,202.86 |
| April | 2,381 | 5,256 | $17,441.96 | $42,475.78 |
| May | 9,224 | 6,335 | $72,052.88 | $41,384.60 |
| June | 86,565 | 16,998 | $296,856.53 | $82,739.65 |
| Average for period | 23,590 | 9,574 | $123,531.68 | $61,311.42 |
The top five share volume leaders on BISX for the six month period January 1, 2016 to June 30, 2016 with their contribution to total traded volume displayed as a percentage were:
| SYMBOL | TRADE VOLUME | % OF VOLUME |
| DHS | 1,522,749 | 51.4% |
| FCL | 325,826 | 11.0% |
| CBL | 270,808 | 9.1% |
| CHL | 227,237 | 7.7% |
| CAB | 225,370 | 7.6% |
The top five share value leaders on BISX for the six month period January 1, 2016 to June 30, 2016 with their contribution to total traded value displayed as a percentage were:
| SYMBOL | TRADE VALUE | % OF TRADE VALUE |
| CBL | $2,288,333.86 | 14.8% |
| DHS | $2,149,673.09 | 13.9% |
| FCL | $2,140,387.50 | 13.9% |
| CAB | $1,505,349.83 | 9.7% |
| FIN | $1,421,364.50 | 9.2% |
The top five share volume leaders on BISX for the three month period April 1, 2016 to June 30, 2016 with their contribution to total traded volume displayed as a percentage were:
| SYMBOL | TRADE VOLUME | % OF VOLUME |
| CBL | 132,170 | 22.4% |
| AML | 89,810 | 15.3% |
| CHL | 68,708 | 11.7% |
| FIN | 63,973 | 10.9% |
| FCL | 53,510 | 9.1% |
The top five share value leaders on BISX for the three month period April 1, 2016 to June 30, 2016 with their contribution to total traded value displayed as a percentage were:
| SYMBOL | TRADE VALUE | % OF TRADE VALUE |
| CBL | $ 994,548.02 | 29.1% |
| FIN | $ 703,703.00 | 20.6% |
| CHL | $ 354,108.37 | 10.4% |
| FCL | $ 321,560.00 | 9.4% |
| AML | $ 198,648.60 | 5.8% |
For Additional Information Contact:
Elude Michel-Sturrup
Tel: 242-323-2330
Fax: 242-323-2320
Email: info@bisxbahamas.com
