BISX is pleased to announce its BISX All-Share Index and trading statistics for the three-month period ending March 31, 2025 with comparison to the same period of 2024.
BISX ALL SHARE INDEX
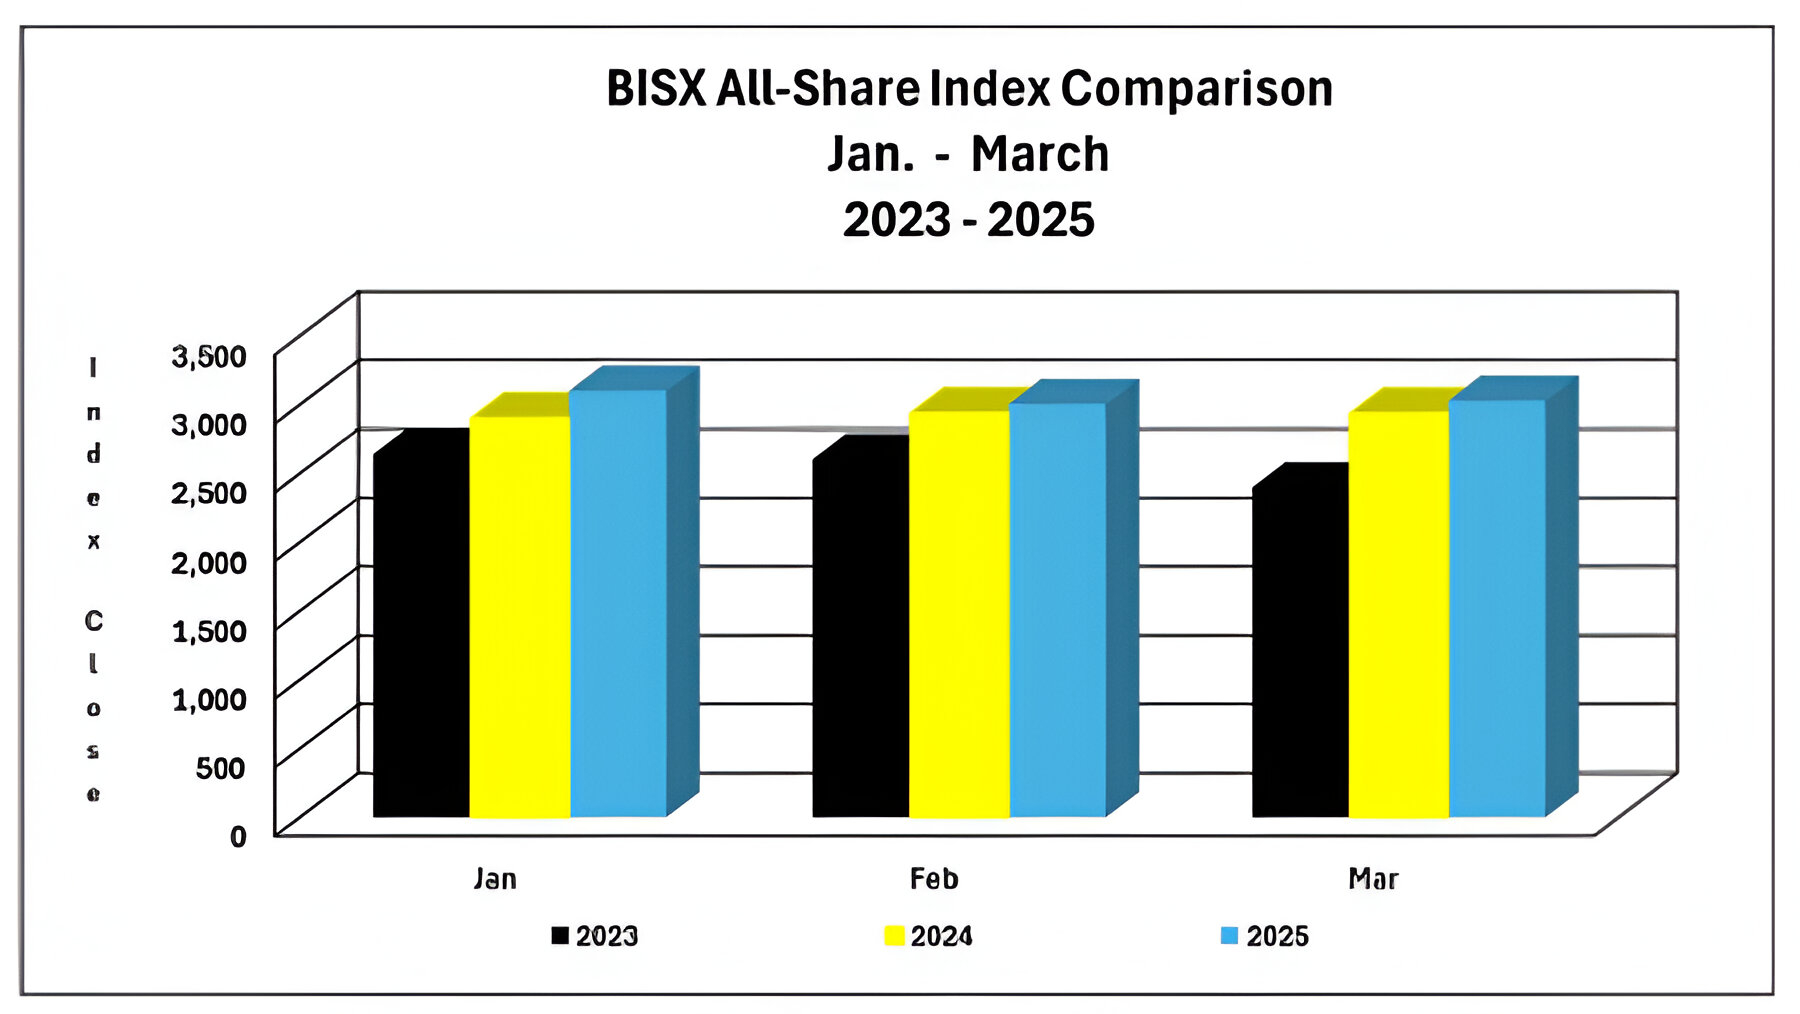
For the three-month period ending March 31, 2025 the BISX All-Share Index closed at 3,026.26. This represents a year to date increase of 18.04 or 0.60%. By comparison, for the three-month period ending March 31, 2024 the BISX All-Share Index closed at 2,937.08. This represents a year to date increase of 85.44 or 3.00%. The BISX All-Share Index is a market capitalization weighted index comprised of all primary market listings excluding debt securities.
As at March 31, 2025 the market was comprised of 20 ordinary shares with a market capitalization of $6.67 Billion. In addition, there were 4 preference shares with a market capitalization of $60 million, 5 BGS and Corporate Bonds with a face value of $349 Million and 254 BGRS with a face value of $4.5 Billion.
MARKET CAPITAL
Over the 3-year period 2023 to 2025, the market value of all securities listed on BISX has shown an increase
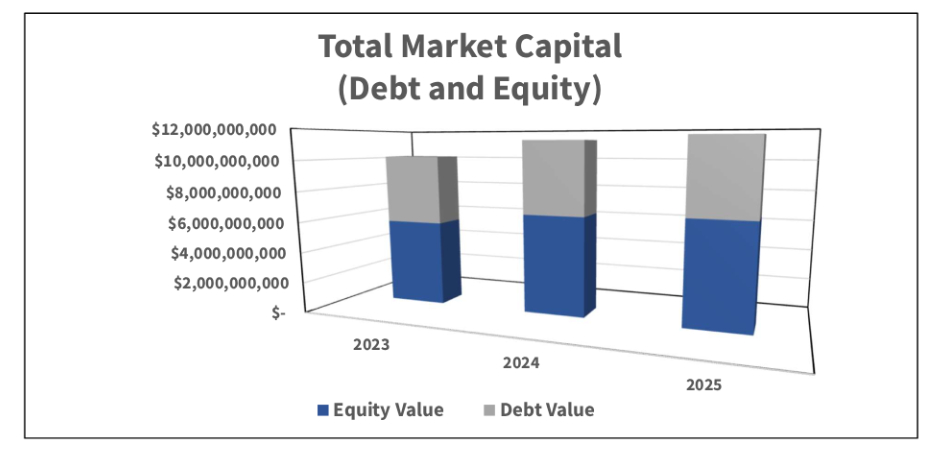
| Year | Market Cap (Equity) | Market Cap (Debt) | Total |
|---|---|---|---|
| 2023 | $6,237,115,577.61 | $4,517,496,700.00 | $10,754,612,277.61 |
| 2023 | $6,481,331,793.01 | $4,776,613,800.00 | $11,257,945,593.01 |
| 2024 | $6,731,786,915.49 | $4,871,237,400.00 | $11,603,024,315.49 |
COMPARISON OF BISX ALL SHARE INDEX TO INTERNATIONAL INDICES
Three month performance for selected international indices with comparison to the BISX All Share Index is presented below:
| Closing Date | Jamaican Stock Exchange Main Index | S&P 500 Index1 | FTSE 100 Index2 | BISX All Share Index |
|---|---|---|---|---|
| 31-Dec-24 | 335,794.94 | 5,881.63 | 8,173.00 | 3,008.22 |
| 31-Mar-25 | 330,104.29 | 5,611.85 | 8,582.80 | 3,026.26 |
| Percentage Change (+/-) | -1.69% | -4.59% | 5.01% | 0.60% |
1 Standard &Poor’s (S&P) 500 Index is a market capitalization weighted index made up of 500 large cap U.S. companies. www.standardandpoors.com
2 The FTSE 100 Index is a market capitalization index representing the performance of 100 of the largest UK domiciled companies. www.ftse.com
TOTAL TRADES BY SECURITY CLASS
For the three-month period ending March 31, 2025, trading in each type of security produced the totals in the chart below:
| Type of Security | Volume | Value |
|---|---|---|
| Ordinary Shares | 1,330,491 | $8,260,981.77 |
| Government Bonds – BGRS | 36,137 | $3,459,001.68 |
| Total | 1,366,628 | $11,719,983.45 |
TRADING VOLUMES AND VALUES
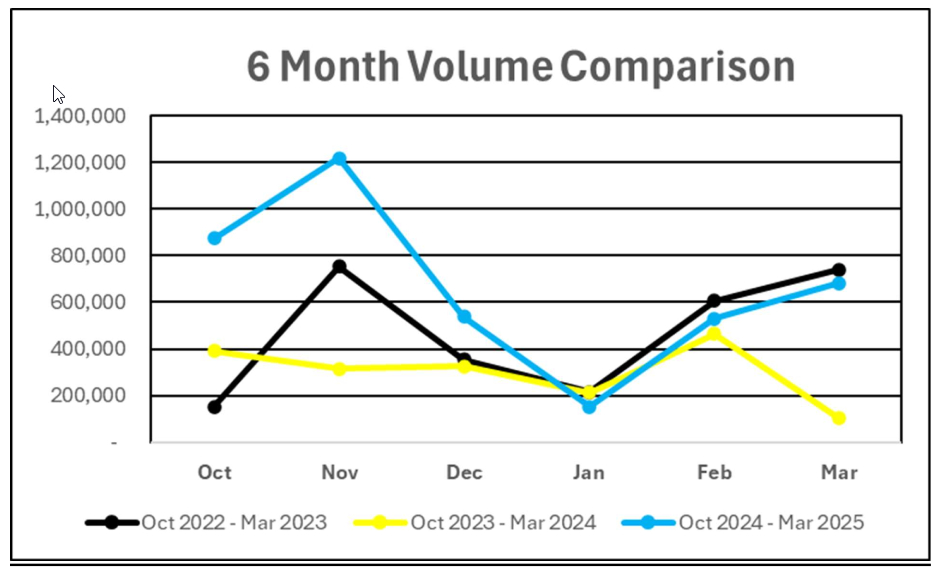
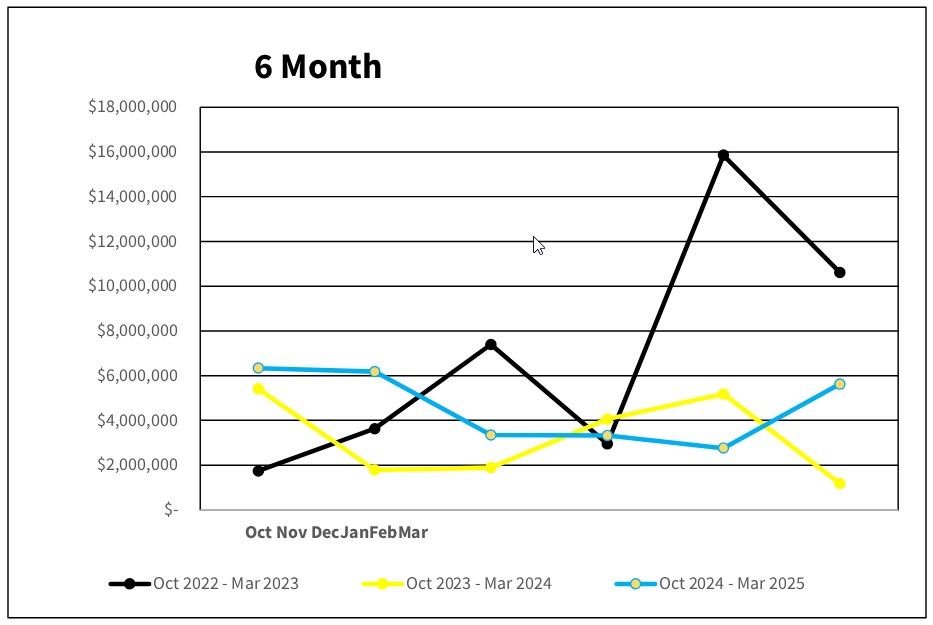
Trading volume for the three month period January 1, 2025 to March 31, 2025 was 1,366,628 securities for a value of $11,719,983.45. By comparison, trading volume for the three-month period January 1, 2024 to March 31, 2024 was 780,614 securities for a value of $10,433,219.57.
AVERAGE DAILY VOLUME AND VALUE
For the three-month period from January 1, 2025 to March 31, 2025, the average volume per trading day was 21,693 shares for a value of $186,031.48. By comparison, for the three-month period from January 1, 2024 to March 31, 2024, the average volume per trading day was 12,473 shares for a value of $166,546.02.
| Month | Avg. volume / trading day (2025) | Avg. volume / trading day (2024) | Avg. value / trading day (2025) | Avg. value / trading day (2024) |
|---|---|---|---|---|
| January | 7,274 | 10,147 | $158,590.78 | $193,376.01 |
| February | 25,259 | 22,087 | $131,826.50 | $247,082.33 |
| March | 32,544 | 5,185 | $267,677.17 | $59,179.72 |
| Average for period | 21,693 | 12,473 | $186,031.48 | $166,546.02 |
SHARE VOLUME AND VALUE LEADERS (THREE MONTH PERIOD)
Overall BISX Volume and Value Leaders (3 Month Period)
The top five share volume leaders on BISX for the three-month period January 1, 2025 to March 31, 2025 with their contribution to total traded volume displayed as a percentage were:
| SYMBOL | TRADE VOLUME | % OF VOLUME |
|---|---|---|
| CBL | 531,187 | 38.9% |
| FCL | 248,830 | 18.2% |
| CAB | 208,880 | 15.3% |
| BWL | 193,000 | 14.1% |
| BOB | 45,888 | 3.4% |
The top five share value leaders for the three-month period January 1, 2025, to March 31, 2025 with their contribution to total traded value displayed as a percentage were:
| SYMBOL | TRADE VALUE | % OF TRADE VALUE |
|---|---|---|
| CBL | $2,655,391.49 | 22.7% |
| BWL | $1,912,561.94 | 16.3% |
| FCL | $1,523,533.80 | 13.0% |
| CAB | $748,477.00 | 6.4% |
| BSBGR1321391 | $706,588.68 | 6.0% |
Equity Volume and Value Leaders (3 Month Period)
The top five share volume (equity) leaders on BISX for the three-month period January 1, 2025 to March 31, 2025 with their contribution to total traded equity volume displayed as a percentage were:
| SYMBOL | TRADE VOLUME | % OF VOLUME |
|---|---|---|
| CBL | 531,187 | 38.9% |
| FCL | 248,830 | 18.7% |
| CAB | 208,880 | 15.7% |
| BWL | 193,000 | 14.5% |
| BOB | 45,888 | 3.4% |
The top five share value (equity) leaders for the three-month period January 1, 2025, to March 31, 2025, with their contribution to total traded equity value displayed as a percentage were:
| SYMBOL | TRADE VALUE | % OF TRADE VALUE |
|---|---|---|
| CBL | $2,655,391.49 | 32.1% |
| BWL | $1,912,561.94 | 23.2% |
| FCL | $1,523,533.80 | 18.4% |
| CAB | $748,477.00 | 9.1% |
| BSBGR1321391 | $304,229.00 | 3.7% |
BRS Value Leaders (3 Month Period)
The top five share value (BRS) leaders for the three-month period January 1, 2025, to March 31, 2025, with their contribution to total traded BRS value displayed as a percentage were:
| SYMBOL | TRADE VALUE | % OF TRADE VALUE |
|---|---|---|
| BSBGR1321391 | $706,588.68 | 20.4% |
| BSBGR1242381 | $385,743.00 | 11.2% |
| BSBGR1341407 | $224,012.64 | 6.5% |
| BSBGR1292394 | $215,630.13 | 6.2% |
| BSBGR1090368 | $202,242.60 | 5.8% |
For Additional Information Contact:
Elude Sturrup
Tel: 242-323-2330
Fax: 242-323-2320
Email: info@bisxbahamas.com
