FOR IMMEDIATE PUBLICATION
JANUARY TO JUNE 2025 STATISTICAL REPORT
BISX is pleased to announce its BISX All-Share Index and trading statistics for the six-month period ending 30 June 2025, with comparison to the same period of 2024.
BISX ALL SHARE INDEX
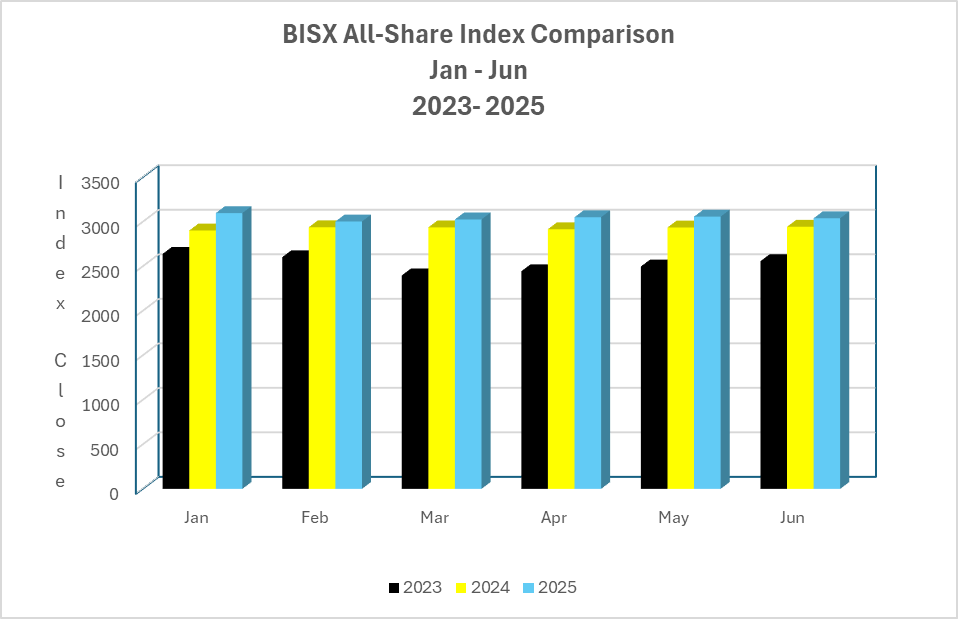
For the six-month period ending 30 June 2025, the BISX All-Share Index closed at 3,039.04. This represents a year-to-date increase of 30.82 or 1.02%. By comparison for the six-month period ending 30 June 2024, the BISX All-Share Index closed at 2,943.54. This represented a year-to-date decrease of 91.90 or 3.22%. The BISX All-Share Index is a market capitalization weighted index comprised of all primary market listings excluding debt securities.
As at 30 June 2025 the market was comprised of 20 ordinary shares with a market capitalization of $6.7 Billion. In addition, there were 4 preference shares with a market capitalization of $60 Million and 5 BGS and corporate bonds with a face value of $349 Million and 242 BRS with a face value of $4.5 billion.
Additionally, as at 31 December 2024, there were 51 mutual funds listed on BISX with approximately $4.2 Billion in Assets under Management, of these 20 were Bahamian dollar funds with Assets under Management (AUM) of approximately B$1.5 Billion.
MARKET CAPITAL
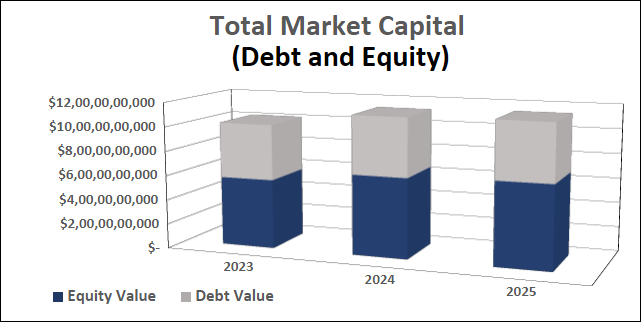
Over the 3-year period from 2023 to 2025, the market value of all securities listed on BISX has shown increases.
| Year | Market Cap (Equity) | Face Value (Debt) | Total Value |
|---|---|---|---|
| 30 June 2023 | $5,651,836,299.31 | $4,517,496,700.00 | $10,169,332,999.31 |
| 30 June 2024 | $6,517,624,700.11 | $4,774,113,800.00 | $11,291,738,500.11 |
| 30 June 2025 | $6,763,300,132.23 | $4,667,357,400.00 | $11,430,657,532.23 |
COMPARISON OF BISX ALL SHARE INDEX TO INTERNATIONAL INDICES
For comparison please see 6 month performance for some international stock indices compared to the BISX All-Share Index below:
| Closing Date | Jamaican Stock Exchange Main Index | S&P 500 Index | FTSE 100 Index | BISX All Share Index |
|---|---|---|---|---|
| 29-Dec-24 | 335,794.94 | 5,881.63 | 8,173.00 | 3,008.22 |
| 28-Jun-25 | 317,312.98 | 6,204.95 | 8,761.00 | 3039.04 |
| Percentage Change (+/-) | -5.50% | 5.50% | 7.19% | 1.02% |
TOTAL TRADES BY SECURITY CLASS
For the six-month period ending 30 June 2025, trade volumes and values by security class are indicated in the chart below.
| Type of Security | Volume | Value |
|---|---|---|
| Ordinary Shares | 3,152,612 | $18,373,220.31 |
| Government Bonds - BRS | 108,504 | $10,547,401.71 |
| Total | 3,261,116 | $ 28,920,622.02 |
TRADING VOLUMES AND VALUES
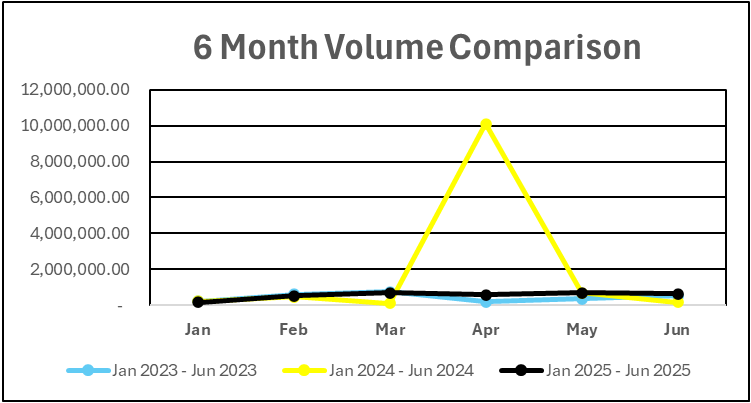
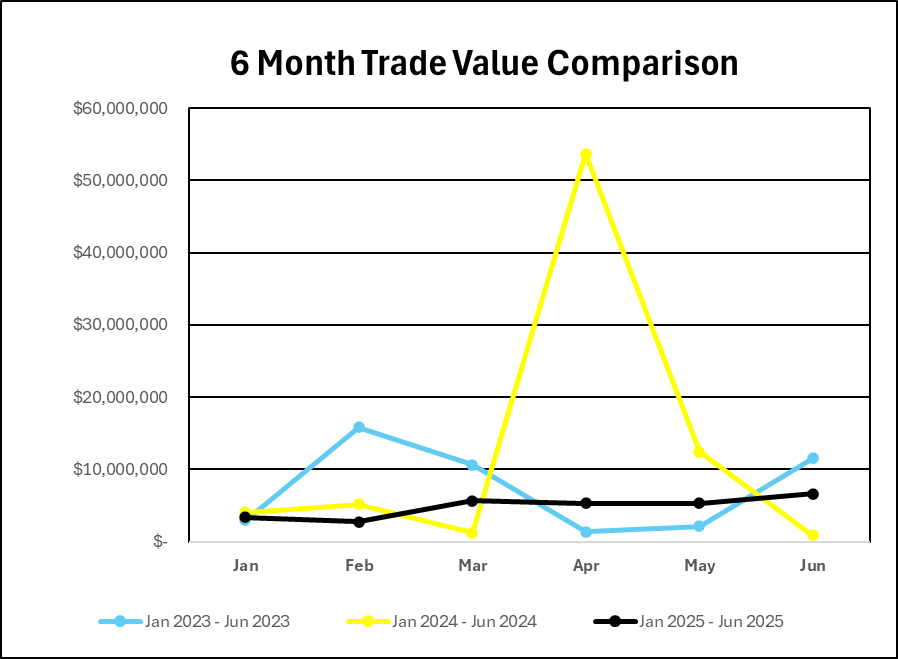
Trading volume for the six-month period 2 January, 2025, to 30 June 2025, was 3,261,116 securities for a value of $28,920,622.02. By comparison, trading volume for the six-month period 2 January, 2024, to 30 June 2024, was 11,739,318 securities for a value of $77,450,073.30.
For the three month period 1 April 2025 to 30 June 2025, trading volume was 1,894,488 securities for a value of $17,200,638.57. Trading volume for the three month period 1 April 2024 to 30 June 2024, trading volume was 10,958,704 securities for a value of $67,016,854.
AVERAGE DAILY VOLUME AND VALUE
For the six month period ending 30 June 2025, the average daily trading volume was 26,605 securities which resulted in an average daily trading value of $236,309.66. By comparison for the six month period ending 30 June 2024, the average daily trading volume was 93,169 securities which resulted in an average daily trading value of $614,683
During the three month period from 1 April 2025 to 30 June 2025 the average daily trading volume was 31,097 securities for a value of $284,390.73.
| Month | Avg. volume / trading day (2025) | Avg. volume / trading day (2024) | Avg. value / trading day (2025) | Avg. value / trading day (2024) |
|---|---|---|---|---|
| January | 7,274 | 10,147 | $158,590.78 | $193,376.01 |
| February | 26,522 | 22,087 | $138,417.83 | $247,082.33 |
| March | 32,544 | 4,938 | $267,677.17 | $56,361.64 |
| April | 28,879 | 480,905 | $263,676.74 | $2,558,600.98 |
| May | 31,033 | 33,023 | $242,230.06 | $591,159.40 |
| June | 33,378 | 7,916 | $347,265.40 | $41,518.37 |
| Average for period | 26,605 | 93,169 | $236,309.66 | $614,683.12 |
VOLUME AND VALUE LEADERS (SIX MONTH PERIOD)
Overall BISX Volume and Value Leaders (6 Month Period)
The top five traded volume leaders on BISX for the six-month period 2 January 2025, to 30 June 2025, with their contribution to total traded volume displayed as a percentage were:
| SYMBOL | TRADE VOLUME | % OF VOLUME |
|---|---|---|
| CBL | 1,330,728 | 41.1% |
| FCL | 925,687 | 28.6% |
| CAB | 390,824 | 12.1% |
| BWL | 198,500 | 6.1% |
| BOB | 68,239 | 2.1% |
The top five traded value leaders for the six-month period 2 January 2025, to 30 June 2025, with their contribution to total traded value displayed as a percentage were:
| SYMBOL | TRADE VALUE | % OF TRADE VALUE |
|---|---|---|
| CBL | $6,512,669.53 | 22.7% |
| FCL | $5,649,241.30 | 19.7% |
| BSBGR1242381 | $2,056,915.40 | 7.2% |
| BWL | $1,969,381.94 | 6.9% |
| CAB | $1,405,158.06 | 4.9% |
Equity Volume and Value Leaders (6 Month Period)
The top five volume (equity) leaders on BISX for the six-month period 2 January 2025 to 30 June 2025 with their contribution to total traded equity volume displayed as a percentage were:
| SYMBOL | TRADE VOLUME | % OF VOLUME |
|---|---|---|
| CBL | 1,330,728 | 42.5% |
| FCL | 925,687 | 29.6% |
| CAB | 390,824 | 12.5% |
| BWL | 198,500 | 6.3% |
| BOB | 68,239 | 2.2% |
The top five value (equity) leaders for the six-month period 2 January 2025 to 30 June 2025 with their contribution to total traded equity value displayed as a percentage were:
| SYMBOL | TRADE VALUE | % OF TRADE VALUE |
|---|---|---|
| CBL | $6,512,669.53 | 36.0% |
| FCL | $5,649,241.30 | 31.2% |
| BWL | $1,969,381.94 | 10.9% |
| CAB | $1,405,158.06 | 7.8% |
| FIN | $397,305.25 | 2.2% |
BRS Value Leaders (6 Month Period)
The top five value (BRS) leaders for the six-month period 2 January 2025 to 30 June 2025, with their contribution to total traded BRS value displayed as a percentage were:
| SYMBOL | TRADE VALUE | % OF TRADE VALUE |
|---|---|---|
| BSBGR1242381 | $2,056,915.40 | 19.5% |
| BSBGR1321391 | $1,085,348.68 | 10.3% |
| BSBGRS940313 | $985,997.00 | 9.3% |
| BSBGR1200272 | $782,221.50 | 7.4% |
| BSBGR1180276 | $519,450.00 | 4.9% |
VOLUME AND VALUE LEADERS (THREE MONTH PERIOD)
Overall BISX Volume and Value Leaders (3 Month Period)
The top five traded volume leaders on BISX for the three-month period 1 April 2025 to 30 June 2025 with their contribution to total traded volume displayed as a percentage were:
| SYMBOL | TRADE VALUE | % OF TRADE VALUE |
|---|---|---|
| CBL | 799,541 | 42.2% |
| FCL | 676,857 | 35.7% |
| CBB | 183,044 | 9.7% |
| BFH | 36,500 | 1.9% |
| CHL | 28,921 | 1.5% |
The top five traded value leaders for the three-month period 1 April 2025 to 30 June 2025, with their contribution to total traded value displayed as a percentage were:
| SYMBOL | TRADE VALUE | % OF TRADE VALUE |
|---|---|---|
| FCL | $4,125,707.50 | 24.0% |
| CBL | $3,857,278.04 | 22.4% |
| BSBGR1242381 | $1,671,172.40 | 9.7% |
| BSBGRS940313 | $957,200.00 | 5.6% |
| BSBGR1200272 | $777,075.00 | 4.5% |
Equity Volume and Value Leaders (3 Month Period)
The top five volume (equity) leaders on BISX for the three-month period 1 April 2025 to 30 June 2025, with their contribution to total traded equity volume displayed as a percentage were:
| SYMBOL | TRADE VALUE | % OF TRADE VALUE |
|---|---|---|
| CBL | 799,541 | 44.4% |
| FCL | 676,857 | 37.6% |
| CAB | 181,944 | 10.1% |
| BFH | 36,500 | 2.0% |
| FIN | 23,010 | 1.3% |
The top five traded value (equity) leaders for the three-month period 1 April 2025 to 30 June 2025, with their contribution to total traded equity value displayed as a percentage were:
| SYMBOL | TRADE VALUE | % OF TRADE VALUE |
|---|---|---|
| FCL | $4,125,707.50 | 42.0% |
| CBL | $3,857,278.04 | 39.2% |
| CAB | $656,681.06 | 6.7% |
| FIN | $347,062.75 | 3.5% |
| CIB | $176,595.00 | 1.8% |
BRS Value Leaders (3 Month Period)
The top five value (BRS) leaders for the three-month period 1 April 2025 to 30 June 2025, with their contribution to total traded BRS value displayed as a percentage were:
| SYMBOL | TRADE VALUE | % OF TRADE VALUE |
|---|---|---|
| BSBGR1242381 | $1,671,172.40 | 23.6% |
| BSBGRS940313 | $957,200.00 | 13.5% |
| BSBGR1200272 | $777,075.00 | 11.0% |
| BSBGR1180276 | $519,450.00 | 7.3% |
| BSBGRS970336 | $401,680.00 | 5.7% |
For Additional Information Contact:
Elude Michel-Sturrup
Tel: 242-323-2330
Fax: 242-323-2320
Email: info@bisxbahamas.com
